Thursday, December 31, 2009

Should the US have More Say at the IMF?

The United States is typically believed to have too large a presence in global financial and military institutions. Former World Bank Chief Economist Joseph Stiglitz criticized the IMF for being too much a tool of the Washington Consensus during the Asian financial crisis. The Fund itself built its massive (and highly secured) headquarters only blocks from the White House. Yet for all its influence, a new report by the Congressional Research Service makes the US look more like underrepresented China than like EU powers.

The figure below charts the proportion of IMF votes against a country’s share of global GDP.

According the CRS report, the US “is unlikely to lose voting power in the negotiations, as the United States is actually an under-represented country at the IMF. The United States chose to allow its proportional share to decline in recent decades, partly to make room for new members and partly to lower its financial obligation.”

I’ve written about IMF voting shares previously and shown the US is by no means lacking representation. Under a move this year to allow the IMF to respond to the current crisis by selling some gold, the US still has 16.73 percent of all IMF votes. That’s the largest share to any single country and more than twice the 6.23 percent of votes given to Japan the second most prominent country. Additionally, the so-called BRIC (Brazil, Russia, India, and China) developing countries make up only 10.26 percent of IMF votes. That’s a large share but it still leaves the US as the dominant power.


Nor is global GDP really the relevant measure. IMF votes are assigned proportionately to contributions to IMF funds, not to global output. In other words, the US’s official position in global financial institutions has more to do with our level of involvement than with superpower status. As measures to reform global finance in the wake of the crisis, staying involved should be a priority.

Wednesday, December 30, 2009

The New GM Theory

I haven’t written about the auto bailout in sometime. I mostly skipped writing about Cash for Clunkers. I’ll say now that the program appears to have increased the price of used cars by scrapping many of the clunkers. Americans who decried bailouts to risk taking banks sadly saw little resemblance to having their investments in their cars propped up to the disadvantage of first time car buyers.

But Cash for Clunkers, which cost about $2.8 billion, looks about as expensive as Goldschlager looks gold-dense when compared to the funds given to auto companies directly. The first annual report of the Office of Financial Stability shows that the US government still has almost $15 billion in loans out to Chrysler, GM, and GMAC. The figure below shows how these loans were converted into government ownership of Chrysler and GM.

Now the government at least bought into GM near a historic low point for the company, so any uptick could generate some returns but the company’s ownership has been radically reorganized. Chrysler will face challenges from being majority-owned by VEBA, a representative of employees and their pension funds. GM faces a less clear future being owened largely by governments that say they don't want to own auto companies. Further complicating GM is that the company is co-owned by the American and Canadian government.
Now let’s think this through. We now have a large firm, with high fixed costs, a lagged cycle for innovation and high costs to making one year of bad products, owned by multiple governments, facing tough international competition. I think I’ve seen this game before, in fact I think applying it to Airbus helped win Paul Krugman a Nobel Prize. Yet the now classic Boeing-Airbus game doesn’t say that governments should dump their corporate investments but should instead encourage domestic production in such markets.

Thursday, December 17, 2009

The Tax that Wasn't

I've got a post over at the Enterprise blog today on the Social Security earnings test. I'm propsing the unconvential approach that misunderstanding about the test could actually cause people to work longer.

Wednesday, December 16, 2009

Balancing Act


The Federal Open Market Committee just released its policy statement. No major surprises here. The Federal Funds Rate is staying in its 0 to .25 range. For some time I’ve been using the compare function of MS Word to track the changes in the FOMC’s statements. The function which is meant to find revisions in updated versions of the same document works surprisingly well for the FOMC. In other words, there are not a whole lot of changes between statements. The minimalist approach means that I’m going to each change got Joyciean attention (James Joyce was rumored to have ceased writing for days simply to fixate on one word that he wanted to get right).

So here are this month’s changes. The Fed is
1. Shifting the winding down of the MBS purchases into the present tense.
2. Says firms are “reluctant to hire” rather than the active cut backs from last month.
3. Eliminates the phrase “the fed is monitoring the size and composition of its balance sheet”
4. Has reaffirmed its commitment to end most of its special programs by February 1, 2010.

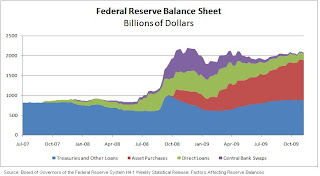
I’m still watching the balance sheet, given that, as the chart above shows it’s still double the size that it was before the crisis began. Additionally, it's the red section of the chart, direct asset, purchases that is growing and likely carries the most risk. Just as Treasury has called the Capital Purchase Program closed even while sitting on nearly $100 billion of potentially toxic assets, the Fed may be stuck with a good deal of garbage for a long time.

Wednesday, December 2, 2009

New York, Unequal New York

This morning, Felix Salmon of Reuters pointed out an “income barbell” on Manhatten and some of its boroughs. The post begins:

Did you know that there are more rich households (anything over $192,000 a year for a family of four) in Bay Ridge than there are on the East Side south of 14th Street?

Salmon’s post draws on a mapping application from Envisioning Development.

I’ve never been to Bay Ridge and my time in New York City is only cursory. I actually noted the post mostly because of the great work being done in that neighborhood by a Columbia J-School student.

But from the Envisioning Development data, I was able to test just how much of a barbell there is in any New York neighborhood. For the reasons above, I’ve picked Bay Ridge as a test case. The EV map provides a number of people in various income ranges for each neighborhood. For instance, the Bay Ride data says that 5,595 middle income families, who earn between $61,000 to $91,000, live in the neighborhood. The EV data also reports that the median income in the neighborhood is $65,800* or 85 percent of the citywide median. The distribution is called a “barbell” due to the large number of people near the bottom and the top.

Yet it turns out that the barbell in Bay Ridge is not really much different from the national average. I drew this conclusion by simulating the distribution of Bay Ridge’s income form the EV data. I created a random sample of families with income distributions the same as the EV data. Since the EV data only provides a range of incomes, I’ve assumed that any income value within a given range is equally likely. The other assumption used in my analysis is to top code the income distribution at $325,000.&

I’ve compared my analysis to a common metric of income inequality, the Gini Coefficient. Gini values close to zero indicate equal income across a population and Gini values close to one are more unequal.

According to the Census Bureau the national Gini index was .461 in 2007. I’ve produced a value of about .42, on average for multiple iterations, of the simulation.

Below is the Lorenz Curve, the graphical representation of Gini, for a single iteration of the sample.

*My simulated cohorts produce a similar value.& Public Use Micordata released by the Census Bureau typically top codes at $250,000. I’ve used a higher value to account for the smaller than usual sample size.